Every vendor, analyst and end-user company in the process industries describes asset performance management (APM) differently, with definitions ranging from data management strategy, to software and workflows, to decision-making processes. The Gartner definition — one of the more comprehensive — states that APM encompasses the capabilities of data capture, integration, visualization and analytics tied together for the explicit purpose of improving the reliability and availability of physical assets.1
In a vendor-heavy market, one of the greatest challenges to implementing a successful APM strategy is often identifying which building blocks are best for an organization. One of the most common misconceptions in this journey is that it must occur linearly, beginning with a data capture and management strategy, but some of the most successful implementations begin by envisioning the result.
Imagine first identifying the required outputs of the APM strategy and working backwards. This can be a great way to ensure that the foundation of data storage, access and analytics capabilities support the desired outcomes.
Moving from insight to action…
One of the primary considerations for analytics solutions being used in APM is how the output is presented and shared with others in the organization. Flexibility is a critical component — flexibility in visualization options, in displaying focused versus roll-up views, in the amount of information shared and in the way it is shared — and it is key when it comes to enterprise-wide solution adoption.
Managers are frequently most interested in high-level OEE metrics, summarized in tables and pareto graphs of bad actors when making business plans. Meanwhile, operators and process engineers desire simple interfaces for comparing all assets under their responsibility to identify which are most likely to cause problems in the near term. Furthermore, reliability and maintenance engineers desire methods to dig into the data around bad actor assets to understand root causes. A chosen analytics solution must contain various interactive and static visualization options for live dashboarding and reporting, and be easily navigable between one and many assets.
….And from data to insight
Applying time series data analytics effectively is difficult due to high volumes of information (which compound over time), high frequency required for logging and disparate systems of record. This type of analysis historically took place using spreadsheets, but these are incredibly cumbersome when filled with large quantities of data, require manual manipulation and quickly reach row and file size limitations. These constraints — paired with the fact that data is no longer live the moment it is copied into a spreadsheet — solidifies the need for a better approach.
Solutions must possess unique time series analytics capabilities, and be able to complete calculations performantly across any number of assets required by a given manufacturing company. Analysis of time series data is underpinned by the ability to encapsulate specific time periods of interest to focus and bound calculations. Once identified, these focus periods can translate into performance metrics, golden profiles, regression model training data sets and more, and these outputs help inform operations decisions that drive business value.
Data storage and structure considerations
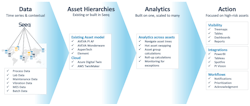
APM solutions are typically piecemeal, with different software tools for achieving different objectives. This approach promotes collaboration among vendors at various points along the solution spectrum, and innovation-driving competitions among those with similar offerings. Seeq (Figure 1), an advanced analytics solution, federates process manufacturing companies’ mixed bags of process historians and databases, whether hosted in the cloud or on-premises.
In addition to performant storage systems for process and contextual data, a structure to organize the data is also required. Many companies implement asset hierarchies to help organize tag data, tying it to useful metadata, such as physical equipment and location. These structures help data users locate the necessary tags, and if configured appropriately, scale their analytics calculations. Solutions that offer flexible asset hierarchy capabilities — such as building new hierarchies specific to particular analyses or modifying existing hierarchies for the subset of assets of interest — provide even greater advantages.
Recipes for success
Real-world case studies in this area are plentiful, comprised of assets ranging in size from single control loops to entire oil field production systems. They overlap in need for easy-to-implement time-series analytics involving unique data sources, and can be organized into asset hierarchies built for use cases deployed at scale.
Chevron Oronite — a manufacturer of lubricants, fuel additives and chemicals — has a goal of minimizing Co-Gen turbine runtime while continuing to provide reliable power for site operations. The company uses an advanced analytics solution to combine flexible calculation methodologies with ad hoc and repeatable asset hierarchies to predict and roll up the total available power generated by turbines in its Co-Gen unit. Subject matter experts (SMEs) then use these predictions to inform operational decisions, aiming to reduce the number of Co-Gen turbines online to save the company maintenance expenses and reduce sites’ carbon footprints.
The technical details
This use case starts with live data connectivity and Chevron Oronite’s ability to simultaneously view and analyze process data from its plant historian, along with forecasted and actual weather data from a web API. Its advanced analytics solution, Seeq, provides this multi-datasource environment with the asset hierarchy construction, flexible time-series calculations and collaboration capabilities required for efficient APM.
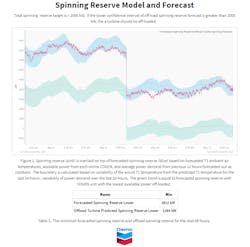
Using a regression algorithm built into the solution, the company can correlate past temperature forecast data with actual values to predict temperature values that account for the uncertainty of forecast data. SMEs then use predicted temperature to plot the available power of each turbine based on a well-established correlation between ambient temperature and power generated. To account for drift between modeled and actual values over time, the model undergoes continuous retraining using the most recent two days of data.
Chevron Oronite uses asset templating to scale the model-building exercise rapidly across all five of its Co-Gen turbines, three or four of which are operating at any given time. Building out this use-case-specific asset hierarchy also provides the capability to perform roll-up calculations on key metrics, such as the total available power at any time. Comparing this roll-up of total available power with the previous 24-hour power demand equips operations staff with data to make decisions on when to take turbines offline, for example when the predicted power generated is greater than 2000 kW over the previous day’s demand.
Chevron Oronite lead process engineer, Christopher Harp, notes the browser-based advanced analytics solution’s sustainability and support for employee succession. “I can share [each Data Lab Notebook] with the next process engineer, and they can run the script and output the exact same structure, resulting in consistency,” Harp says.
This consistency is critical for ensuring analytics and their acceptance among operations teams continue in the future.
Back to the basics
Getting the most out of an APM strategy begins with the data. Data must be available and accessible to those who need it, in environments that are source-agnostic, along with flexible calculation capabilities that support both ad hoc and structured time-series analytics. Finally, insights derived from analyses must be shareable and actionable within an organization and externally throughout supply chains so value can be added.
1 https://www.gartner.com/en/information-technology/glossary/asset-performance-management-apm
Allison Buenemann is the Chemicals Industry Principal at Seeq Corporation. She has a process engineering background with a BS in Chemical Engineering from Purdue University and an MBA from Louisiana State University. Allison has nearly a decade of experience working for and with bulk and specialty chemical manufacturers like ExxonMobil Chemical and Eastman to solve high-value business problems leveraging time series data. In her current role, she enjoys monitoring the rapidly changing trends surrounding digital transformation in the chemical industry and translating them into product requirements for Seeq.
Seeq Corporation


