By Bob McGregor
Determining appropriate particle sizes for constituent powders is an important design task in tablet creation. The choices made ultimately impact the manufacturing process.
Moreover, granulating powders to the correct size and shape is only part of the challenge in achieving acceptable product performance for the consumer. Once the constituents are prepared and blended together, manufacturing must focus on flow behavior for the overall mixture. Blending does not necessarily preserve the flow behavior of the individual components, even when particle size is relatively uniform.
The question is whether the mixture will discharge reliably in gravity powder flow through a hopper while the different ingredients stay mixed together.
Historical experience
Mass flow is the performance objective when pharma R&D teams design a new product or make modifications to an existing formulation. This means that the powder mixture from the blending process will flow uniformly in gravity discharge through the hopper opening. Figure 1 illustrates mass flow. The particles maintain relative position to one another, thereby minimizing possibilities for desegregation to occur.
Steps taken to achieve mass flow include hopper designs with relatively steep-angled walls and use of flow aids to minimize inter-particle friction. Processors know that these approaches are effective. Test methods that predict flow behavior prior to scale-up have had limited success, so prior manufacturing experience with similar formulations provides important guidance for what works best.
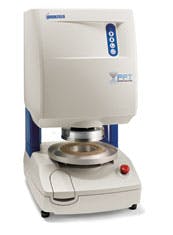
The technology of analyzing and predicting powder flow behavior has recently entered a new area with the advent of affordable and easy-to-use shear cells that can quickly make this assessment (Figure 2). Antiquated methods utilizing cups with holes in the bottom, sifters, angle of repose measurement and tap tests are giving way to a proven scientific method for measuring inter-particle friction during flow under gravity.
Shear cells perform a direct measurement of the sliding friction between particles as well as the friction of the powder mixture moving against the hopper wall. Although this methodology has existed for years, its practice had been limited to those who could afford the equipment purchase, invest in the technician to operate the instrument and have an expert who could interpret the results.
Powder flow problems
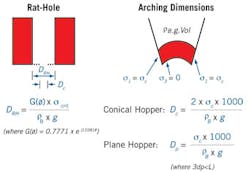
Powders can form stable structures in a bin that limit or completely obstruct movement. "Arch" and "Rat-Hole" are two expressions used to describe powder blockages in the bin. The physical dimensions for characterizing these stable structures are length and diameter respectively, calculated mathematically by the formulae shown in Figure 3. The powder’s structural strength, i.e., its ability to resist movement, is called the "unconfined failure strength" and is measured by the shear cell.
Obstructions in the bin can only be overcome by the weight of the powder above, which causes the structure to collapse and the powder to flow downward. If the weight is insufficient compared to the powder’s failure strength, the structure maintains its integrity and powder flow is adversely impacted.
Powder build-up on the wall of a hopper is another condition that can slow down flow out the opening. Even when a hopper is in a relatively clean condition at the beginning of a run, the powder will gradually coat the surface and potentially reduce flowability. Quantifying this phenomenon requires the ability to measure the change in wall friction over time.
How shear cells work
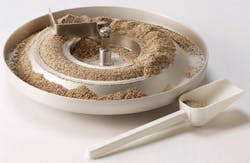
The cell is the container that holds the powder sample. Volume requirements can range from 50cc to 300cc, depending on the cell size. Figure 4 shows an annular design for the cell geometry, which has advantages in terms of the uniform shearing action that takes place on the powder sample during the test.
Flow function and wall friction are the two types of tests run with the shear cell. For each there is a uniquely designed lid (see Figure 5) that comes down on top of the sample, compresses the powder to a defined pressure and then shears against the powder to measure the friction.
This way of applying pressure is referred to as "consolidation" and simulates the physics of what happens in the bin when fresh powder is poured in. As the powder fills up, the material in the hopper section feels the increasing weight of the powder above. By consolidating the powder sample at different pressures, the shear cell replicates what is physically happening to the powder in the bin.
At each consolidation pressure, the cell rotates through a short distance and the instrument measures the resistance to movement, which is essentially the failure strength of the powder. The graph in Figure 6 shows examples of data from several flow function tests on different powder samples.
The x-axis represents the consolidating pressure or stress applied to the powder sample, which is the control parameter. The y-axis represents the failure strength of the powder sample, which is the measured parameter.
Note that the graph illustrates different regions for flow behavior, ranging from "Free Flowing" to "Non Flowing." This classification has been established by industry and gives a quick indication of the ease or difficulty in flow behavior. Obviously, if the data shows a non-flowing behavior, the powder will cause serious problems during processing.
This wall friction test method is similar to flow function in that the wall friction lid compresses the powder sample at multiple consolidating pressures. The shearing action of the lid during cell rotation measures the wall friction. Because the condition of the wall surface in the hopper is likely to vary over the course of operation, it’s important to consider how to prepare the wall friction lid for the test. Build-up of a powder coating on the lid may be more representative of what’s happening in the hopper. The logical conclusion is that the measured wall friction values will run higher for a coated lid versus a clean surface lid.
Benchmarking
Powders that have flowed well from past experience are the ideal candidates for processing. By running a flow function test on successful powders, manufacturing creates a reference benchmark for future formulations. Since component ingredients in a powder mixture are sourced through multiple suppliers, there may be variations in flow performance. The shear cell now provides an established technical method to qualify behavior. If the flow function test produces a graph which deviates significantly from the benchmark, then corrective action is needed, either by adding flow aid or adjusting the granulation.
Shear cells are becoming the tool of choice to predict powder flow behavior before the start of processing. R&D Departments are leading the charge because they are constantly dealing with either new formulations or substitute ingredients for existing formulations. The shear cell allows rapid scale up to full manufacturing.
The quality-control function will begin to adopt the shear cell because tests can now be run automatically without operator involvement. The results can be compared to established benchmarks for processing. When there is deviation from the desired behavior, recommended adjustments to formulation can be quickly made and a second test with the shear cell can verify the effectiveness of the corrective action.
There is little doubt that shear cells are becoming more prevalent as industry turns to this "scientific method" in concert with well established procedures for powder particle analysis.
Robert G. McGregor is general manager, global marketing, Brookfield Engineering Laboratories, Inc. He holds M.S. and B.S. degrees in mechanical engineering from MIT. Reach him at 508.946.6200 ext 7143; [email protected].
Brookfield Engineering Laboratories has long been considered a leader in viscosity measurement and control. In recent years, it has added texture analysis equipment to its line of products. All Brookfield viscometers employ the well-known principle of rotational viscometry; they measure viscosity by sensing the torque required to rotate a spindle at constant speed while immersed in a fluid. The torque is proportional to the viscous drag on the immersed spindle, and thus to the viscosity of the fluid.


