Changing raw material prices, commoditization, increasing regulatory stringency and various other market dynamics all impact process industry margins. In such an active market, it is necessary to be as flexible as possible without tying up big amounts of capital over years to come. This article looks at how a golden fingerprint can be created by modeling past successes. This means that brownfield plants can instead look toward a sustainable future by utilizing process expertise in combination with the plethora of stored process data. One area of improvement is predictive maintenance in order to decrease unplanned downtime.
Recently, a lot has been written about predictive operational performance within process manufacturing industries. The bulk of articles is related to predictive maintenance, where applied sensors are used to analyze and predict equipment behavior. This is mainly focused on the most critical assets through centrally led, time-consuming and expensive predictive data modeling projects. To get operational performance prediction for all assets, a new analytics approach is required: self-service predictive analytics for the subject matter experts.
A smarter approach
Predictive maintenance solutions have traditionally involved data scientists or central improvement experts for building comprehensive analytics models. Aside from being costly and time-consuming, this way of working has other major disadvantages: it creates a bottleneck in the organization, underutilizes subject matter experts and leaves many (smaller) predictive analytics cases unaddressed.
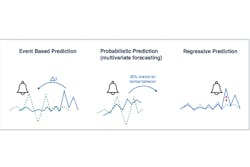
Three ways of self-service predictive analytics. Image courtesy of TrendMiner
A new, integrated and more efficient approach is self-service analytics. This method does not require the expertise of a data scientist nor does it require an extensive overhaul to one’s existing infrastructure. The insights into process and asset behaviors are based on a wealth of historical and real-time data, and with this information, subject matter experts can take proactive measures to reduce downtime and avoid unnecessary risks.
Different ways to execute a self-service predictive analytics strategy
There are three different ways to use this approach:
- Event-based: If a certain signature behavior is detected, which can affect another part in the process that typically occurs later, a notification can be generated.
- Probabilistic: The current behavior is interpreted, and a likeliness of future behavior is calculated.
- Regressive: The prediction is based on certain conditions that must be met and verified.
An example of how self-service analytics can be practical in use is by creating fingerprints, which are created using any variety of signature patterns found in the past. By using defined fingerprints for event-based prediction, automatic alerts can be sent to the appropriate stakeholders, such as control room personnel or field engineers, to take appropriate action in the event of process deviation. The notifications can even include recommendations for mitigating actions.
Another example is by using hypothesis generation for diagnosing issues that fuel new event-based predictions. Behavior in one part of the production line can then be correlated with (future) behavior downstream. Automatic regression of process parameters is, for example, used to make soft sensors to predict product quality.
Asset performance and predictive maintenance
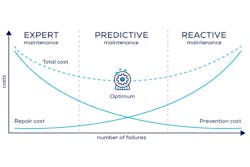
Asset performance, or Overall Equipment Effectiveness (OEE), depends greatly on the process in which the asset operates. Instead of using equipment-related sensor data for performance analysis, all process-related sensor data should be taken into account. This is called "contextualization of asset performance with process data," and with this, data-based predictive maintenance becomes possible.
Predictive maintenance to find optimum in Overall Equipment Effectiveness (OEE). Image courtesy of TrendMiner
The goal of predictive maintenance is to be able to perform maintenance at a time when it is not only the most cost-effective, but also when it will have the least impact on operations. By representing all sensor-generated data in a graph, especially when multiple tags need investigation, it is hard to find correlations. Self-service analytics tools allow the user to quickly explore and filter data visually and search through large amounts of process data (easily up to multiple years of historical data). The advanced analytics capabilities can also help determine root cause analysis (RCA), test hypothesis (discovery analytics) and quickly find similar behavioral occurrences.
Through diagnostic analysis, the process engineer can understand the effects of process changes (comparing before to after) and find potential influence factors for specific issues. With this information, monitors can be created to safeguard best operating zones and maintenance can be predicted.
Practical use cases with self-service predictive analytics
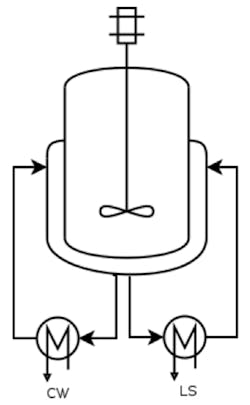
One example where asset performance directly relates to process behavior is the fouling of heat exchangers. In a reactor with subsequent heating and cooling phases, the controlled cooling phase is the most time-consuming, and it is almost impossible to monitor fouling when the reactor is used for different product grades and different recipes are required for each grade. Fouling of heat exchangers increases the cooling time, but scheduling maintenance too early leads to unwarranted downtime and scheduling too late leads to degraded performance, increased energy consumption and potential risks.
In the instance of the production of a polymer, a monitor was set up to look at the cooling times of the most highly produced products. If the duration of the cooling phase starts to increase, a warning is sent to the engineers who can then schedule timely maintenance. The gained benefits are extended asset availability, operational and maintenance cost reduction, and reduced safety risk. The overall impact in this instance was a more than 1 percent overall revenue increase of the entire production line.
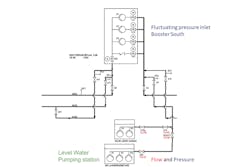
Predict pump failure within a water distribution network to lower overall operational costs.
Within a water distribution network, only 5 percent of all pumping stations were responsible for more than 50 percent of the total maintenance costs. With self-service analytics, using scatter plots and statistical fingerprints, the pumps could be monitored within their best operating zones. Alarms were added and users are now notified when equipment is expected to fail, allowing them enough time to take action. This has improved performance reliability and lowered overall operational costs.
Predict heat exchanger fouling to extend asset availability and increase production. Image courtesy of TrendMiner.
One last use case is within a petroleum refinery where hydrogen fluoride is used as a catalyst in the alkylation unit. It is regenerated in a stripper that is drained to a drum multiple times a day based on the level in the column. After a few days, four thermocouples at different heights in the drum indicate when the drum is full and must be drained. With self-service discovery and diagnostic analytics, it was shown that the time until the drum is full
(indirectly) depends on the acid flow to the stripper column. Using self-service predictive analytics, it can now be determined when the drum will require maintenance. This provides plenty of advance time to schedule the drainage work and lower related maintenance costs.
Conclusion
Traditional predictive maintenance is often time-consuming and isolated from the subject matter experts and consequently only used on the most critical assets. But with this new approach, the day-to-day process experts can be empowered to utilize their knowledge with use of the information hidden in the data historian, and with this they can drive their own predictive maintenance strategies for all equipment within the production line.
Through the use of self-service analytics, every asset can be assessed for performance and predictive maintenance. This method is your crystal ball and the information it provides can result in a reduction of maintenance-related labor costs, reduction in unexpected failures or shutdowns, reduction in repair and overhaul time, and an increase in uptime. And if you look into the future, you just might see a reduction in cost and increase in yield.

