Not long ago, all process plant maintenance activities fell into one of two schools of thought. Equipment was either run to failure — at which point, parts were pulled from an extensive spares inventory and expensive overtime maintenance resources were dispatched — or it was maintained on a too-frequent, set-by-the-vendor-that-wants-you-to-buy-more-parts schedule. At the heart of these crude strategies was a lack of available equipment data, resulting in an inability to predict failures. Fast-forward a decade and process manufacturers have more data than they know what to do with, and the bottleneck has shifted from data collection to data analytics.
Using advanced analytics software, maintenance and reliability teams are now gaining insight from the information received from process sensors and work order databases. They are turning that insight into action, scheduling maintenance activities as determined by predictive analytics.
Analytics 101
“Analytics” is an overloaded term: it is everywhere in software products, platforms and cloud services. One would be hard-pressed to find process manufacturing software that does not claim analytics features or benefits as part of its offering. Therefore, the word “analytics” must now be qualified. This includes modifiers like advanced analytics, which refers to the use of statistics and machine learning innovations in analytics to assess and improve insights. It also includes augmented analytics, which taps into the same innovation themes but puts the analytics in the context of the user experience with business intelligence applications or other easy to use tools.
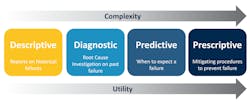
There are also the analytics types typically used to suggest a hierarchy, a “better than” analytics structure, which starts with descriptive analytics (i.e., reports summarizing what has happened), and then diagnostic analytics (root cause investigations), and finally, predictive and prescriptive analytics (Figure 1) to tell the user when to act and what to do. There may be other intermediate steps included, but these four types of analytics are generally included to describe a fixed path to greater analytics sophistication.
While descriptive and diagnostic analytics often serve as gateways to other more complex analytics, there is nothing keeping engineers from heading straight into predictive and prescriptive analytics. In fact, when it comes to maintenance planning, insight into what is expected to happen is typically far more valuable than what has happened in the past. An analysis of historical average run time between failures might provide a more reasonable maintenance period, but it is still scheduled rather than condition-based analytics, and thus may not be optimal.
Predictive analytics enable companies to save money by scheduling resources when conditions warrant, taking corrective action to prevent an undesired outcome, avoiding unplanned downtime for assets and optimizing planned downtime activities.
Analytics in maintenance
The term condition-based maintenance (CBM) has been floated around the last few decades as the idyllic maintenance strategy. The premise of CBM is that an event, trigger or exceedance drives maintenance — rather than a schedule. The challenge with CBM has never been defining the condition prompting the maintenance activity. These conditions are often predefined by ancillary equipment constraints like a maximum allowable temperature or pressure or a minimum flow requirement. The challenge is knowing which constraint will be met and when.
The goal is knowing what is coming in advance so plant personnel can either plan for or optimize decisions based on context, including all costs and tradeoffs. The first step toward predicting the future behavior of a piece of equipment is understanding the past and the present. This is best achieved through a live connection with all relevant process and contextual databases — a hallmark of modern era cloud-based advanced analytics applications.
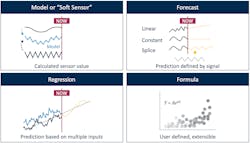
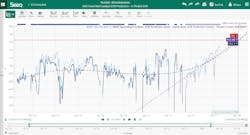
Predictive analytics algorithms can be applied to this dynamic set of live and historical data to determine how the performance of a piece of equipment changes over time or in response to process variability (Figure 2). These equipment performance models can be extremely useful when applied to an extrapolated future data set to identify when the trigger for a future CBM event will occur. With advances in self-service analytics tools, CBM has shifted from an aspiration to a reality.
CBM is often discussed in the context of asset performance monitoring (APM). Once a CBM strategy and a forecast of future performance has been established for one piece of equipment, it is often desired to apply a similar approach across a fleet of assets to perform APM.
Successful implementation of an APM strategy based on CBM requires both a systematic organization of assets (either via an established asset template like OSIsoft Asset Framework or a purpose-built asset hierarchy embedded within an analytics application), along with compute resources proportional to the extent of a company’s assets. The most performant APM implementations leverage advanced analytics applications running on the cloud for flexible scale out and resource provisioning.
Use cases demonstrate predictive analytics progress across industries
Developing a maintenance strategy built on a foundation of predictive analytics has transformed operations in oil and gas, chemicals, pharmaceuticals, and other process industries. Reduction in unnecessary maintenance, downtime and uncertainty is saving manufacturers millions of dollars every year.
Use case 1: Chemicals
Polymer production processes endure a significant amount of fouling as portions of the material being produced coat the insides of pipes and vessels, restricting flow and diminishing heat transfer. Much of this buildup is reversible via online or offline procedures that apply heat to the coated equipment to melt off the foulant layer. One of the world’s largest polyethylene producers was looking for a way to fulfill customer orders sooner by optimizing its defouling strategy.
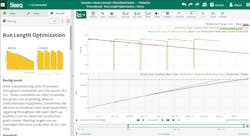
A regression model of the degrading production rate was forecast into the future to determine the date at which the production target would be met if no action was taken. Next, the alternative case was evaluated. Calculations were performed to determine the number of defouls that would minimize the total time to produce a given order size. After determining the optimal number of defoul cycles, engineers were able to determine the appropriate minimum throughput rate trigger and create a golden profile of the optimal number of run cycles between defoul procedures.
Performing this analysis gave engineers and operators the tools they needed to track actual performance against the forecast and to provide advanced notice to resources to prepare for the next defoul (Figure 3).
More accurate estimations of order fulfillment dates were communicated to supply chain teams, and customers received product sooner. This freed up production capacity, resulting in an 11% year-on-year production increase, along with a significant gain in market share.
Use case 2: Pharmaceuticals
Some of the best predictive analytics applications combine statistics techniques with first principles models to create forecasts based on both behavior and theory. In the production of a biopharmaceutical compound, a membrane filtration system is used to separate the desired molecules from other species. Particles build up on the membrane during each batch and are then removed by a clean-in-place procedure run between batches.
Engineers at a major pharmaceutical manufacturer suspected that the clean-in-place procedures were becoming less effective. They needed a way to detect long-term particle build-up on the permeate filter membrane and to predict when a membrane replacement would be required.
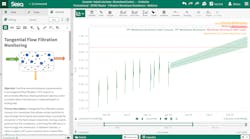
Darcy’s Law was applied to calculate the filter membrane resistance based on pressure and flow sensor data, as well as known values of surface area and fluid viscosity. With the number of variables of interest reduced, engineers saw a clear visual indication of decaying membrane performance (Figure 4).
A regression was performed to model the degradation rate. The model was extrapolated into the future to predict when maintenance triggers would be exceeded, and maintenance activities were scheduled proactively.
Use case 3: Oil & gas
The performance of the fixed bed catalyst in a hydrodesulfurization (HDS) unit degrades over time until it eventually requires replacement. The weighted average bed temperature (WABT) is generally accepted as a key metric indicating catalyst bed health. Creating an accurate model of the WABT is challenging as it can fluctuate due to process variables, such as flow rate and composition. Prior to modeling, the calculated WABT value must be cleansed and normalized to create a suitable data set for calculating a regression model.
Engineers on this HDS unit wanted to know whether the degradation of the catalyst bed had accelerated in recent months. Multiple regression models were calculated and extrapolated to predict the required maintenance date. These predictive models clearly showed the degradation rate had become much more aggressive over the last few months (Figure 5), and that their original time-based catalyst change out would not come soon enough if they continued to operate at current production rates.
Performing this analysis prompted the catalyst change to be performed sooner, eliminating months of constrained rate operation and saving over $5 million.
Conclusion
Predicting the future is more difficult than deciphering the past, but when it comes to process plant maintenance, the benefits are well worth the effort. This is particularly true when an advanced analytics application, like Seeq, is used to accelerate insights. When plant personnel are provided with self-service analytics, they are empowered to predict equipment issues well in advance of required maintenance or failure, with their findings used to optimize maintenance activities.
Allison Buenemann is an industry principal at Seeq Corporation. She has a process engineering background with a B.S. in chemical engineering from Purdue University and an MBA from Louisiana State University. Buenemann has over five years of experience working for and with chemical manufacturers to solve high value business problems leveraging time series data. As a senior analytics engineer with Seeq, she was a demonstrated customer advocate, leveraging her process engineering experience to aid in new customer acquisition, use case development and enterprise adoption. She enjoys monitoring the rapidly changing trends surrounding digital transformation in the chemical industry and translating them into product requirements for Seeq.
