Software solves the tedious process of verifying data on multiple diagrams and drawings
3-D models are effective because they help all parties concerned get a far deeper understanding of a project than traditional 2-D methods. Viewers can analyze and understand spatial relationships much more easily than by looking at a collection of simple photos. For example, when a process engineer or plant manager is looking at the plans for new production unit or plant, 3-D visualization is a major improvement as compared to traditional methods.
Suitable for analysis or just visualization?
Some readers may respond that 3-D plant modeling has been available for years now, and has indeed become very sophisticated, and it contributes to construction of a plant.
In many situations, an engineer trying to perform serious process analysis will spend more time with a traditional process and instrumentation diagram (P&ID). On the other hand, an engineer trying to configure piping and mechanical elements will concentrate on the 3-D models and associated isometric drawings. Why? Because the two formats are designed to convey different types of information, and different teams use each format as needed:
- The process design team creates the P&ID: Here is the piping we need to make the process work.
- The piping design team creates the 3-D models with supporting isometric drawings: Here is how we must build the equipment to implement the requirements laid out in the P&ID.
The P&ID (Figure 1) is assumed to have extensive detail related to the process design. The 3-D model with isometric piping diagrams, provides more analysis of physical layout. 3-D techniques can also concentrate on just the piping in conjunction with the full 3-D plant model and isometric piping diagrams. These provide x-, y-, and z-axes able to indicate what piping is vertical and horizontal. Both must deliver the required level of detail for their purposes and be consistent with each other.
Problems occur when there are inconsistencies among these documents, often stemming from the origins of the different renderings. In most cases, the documents are not produced by the same team, and they are typically created on incompatible types of software tools.
Both activities must happen simultaneously to keep the schedule on time, yet it is very difficult to ensure these two teams talk to each other routinely, stay current with changes on either side and continually update all documents. Bridging this gap, and making all diagrams consistent, must be validated during engineering, procurement and construction (EPC). Examples such as these must be checked to ensure consistency and resolve changes:
- Does the process designer know the piping designer is suggesting a change to the physical layout by rerouting the piping to provide clearance from a pump with a larger footprint than initially expected?
- Does the piping designer know the process designer is calling for a pipe size increase at this point?
For all the sophisticated design tools available, these kinds of changes are still largely implemented manually. This becomes a time-consuming process given the scale of a typical project. A moderate-size process unit can easily have several thousand individual isometric drawings, which must all be compared to the master P&IDs multiple times during a project (Figure 2), requiring thousands of engineering hours. The number of drawings and overall complexity increase with project scale. For example, an LNG processing site can easily have 10,000 detail drawings.
Because manual validation between P&IDs and 3-D models requires extensive effort, it is typically executed infrequently during a project, leading to issues as designs progress and diverge. However, if validation is automated, it can be executed much more frequently, keeping designs consistent and in agreement.
Overlooking a change often causes an inconsistency issue. This might seem to be merely a minor annoyance, until the purchasing department buys a few hundred meters of the wrong-size pipe due to just such an inconsistency.
Automating the tedious verification process
One of the major reasons for the manual verification process is that the two major rendering software tools are incompatible. P&IDs are produced using ISO 15926-compliant XML files. 3-D piping and plant models use intermediate data files (IDFs). These can be reconciled, but the action requires specialized software able to delve into the detail automatically and interpret it correctly. For years now, this has not been practical, but new tools have emerged to perform this very function.
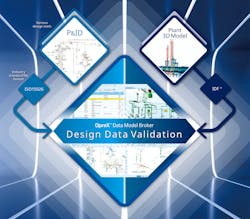
Yokogawa’s OpreX Data Model Broker, for example, has a Design Data Validation function (Figure 3) that operates as cloud-based software-as-a-service (SaaS). It can compare data from the P&IDs with isometric and 3-D models to locate and flag any mismatched data, despite incompatible software tools. By doing so, it can eliminate 80% of the time spent on manual validation checks. Here are four specific areas where it can perform its checking and comparison functions.
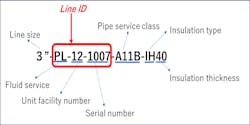
Piping attributes — A P&ID normally assigns a line identification number to each segment of piping (Figure 4) describing its identification and location in the unit — along with relevant attributes, including line size, insulation requirements and service class — which includes material, schedule, etc. This number may be transferred intact to the IDF for the isometric piping diagram and 3-D rendering, or the designer may reformat it to change how it displays the information. For example, it may call out “schedule 40, 304 stainless,” rather than the same data via the service class specification.
It is the job of the Design Data Validation software to compare these designations and look for inconsistencies. Using the line identification code with both files, it must find the same section of pipe on both sides. It must also have the capability to compare the identification code between P&ID and 3-D diagram. Catching this discrepancy can avoid a costly purchasing mistake, or worse.
Piping component order and attributes — Like piping itself, piping component specs must match on both the P&ID and models. These include reducers, branches, valves, instruments, filter housings and other fluid-handling devices. The P&ID must indicate all the relevant attributes, such as input and output diameters to match the immediate piping, component type and connection type — such that it will be clear that the device will fit in the relevant environment and meet the required service class. For example, a mismatch occurs (Figure 5) when the P&ID calls for a ball valve, but the isometric detail drawing shows a gate valve in the same application. The Validation Software will flag these and other similar issues for correction.
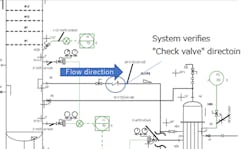
Piping component installation direction — Some piping components are designed for flow in one direction. Check valves or pressure relief valves are obvious examples, but the same applies to flow regulators, filter housings and others. Once the piping component order and attributes are verified, the installation direction (Figure 6) is also critical since a piping technician may not have a positive indication of the flow direction based on observation alone. The Validation Software will ensure the correct direction is indicated on the isometric diagram, and it will flag mismatches for correction.
Flange service class and material breaks — The service class requirements for piping and components can change in a process unit when process conditions change. If pressure drops or a reaction renders process fluid less corrosive, it may be permissible to use a lighter schedule or less expensive material for piping. On the other hand, the opposite may also happen. Where changes occur, the P&ID will call out a material break (Figure 7) and specify the change in service class. Usually these occur at a flange, or at another component, such as a valve.
These break points are very specific and must be in exactly the same location on both the P&ID and 3-D models. The 3-D model will likely not highlight the break point outside of indicating the piping change, therefore the change in class must be indicated correctly. For example, a change from service class 900 to 600 must be conveyed correctly on both diagrams. Does the material change before or after this valve? It is not desirable to upgrade unnecessarily or downgrade more than is allowed due to an inconsistency. The Validation Software will flag these types of mismatches for correction.
Indicating inconsistencies
Validating all these diagrams manually normally requires beginning with a P&ID and its supporting spreadsheets, along with detailed component and piping IDs. Engineers must first verify these against each other, item by item, and then extend to isometric drawings. The 3-D models are made in conjunction with the P&ID and then the isometric details from the 3-D models. Therefore, if there are inconsistencies resulting from errors or change requests, they are the easiest to detect using manual methods by comparing the isometric detail drawings to the P&ID, checking item by item. And with many thousands of line items and drawings, this can consume an enormous amount of time, while invariably missing some proportion of issues due to human error.
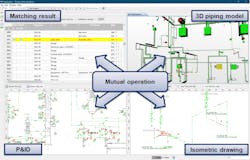
On the other hand, Design Data Validation software looks at all these documents at the same time (Figure 8), comparing them against each other by using artificial intelligence techniques to locate and recognize corresponding data across multiple types and presentation views.
It can find and associate all the records for a given component or section of pipe, determine that they represent the same object and compare the attributes.
- Objects indicated correctly and consistently across all views are highlighted in green.
- Objects indicated on all views but with inconsistent attributes are highlighted in yellow.
- Objects indicated on one or more views but omitted on others are highlighted in red.
The final report of the validation software can be exported as an MS Excel spreadsheet, combined with PDFs for the marked-up P&ID and isometric drawings. Correcting the inconsistencies is still a largely manual process since some judgment is required to determine which answer is correct and where the error may have originated. Users find the amount of time required to perform a complete analysis can be cut by up to 80% by applying this software.
No software hosting required
As mentioned earlier, Yokogawa’s OpreX Data Model Broker and its Design Data Validation operates as cloud-based SaaS. All the actual processing and data analysis happens on Yokogawa’s Cloud servers using data securely uploaded from the plant’s servers with all the spreadsheets, P&ID, isometric and 3-D piping diagram files. The analysis reports can be downloaded from the cloud to any PC or device, but only by authorized users.
OpreX Data Model Broker falls under one of the five main categories under the OpreX banner, encompassing the entire range of Yokogawa's IA products, services and solutions. The five areas are OpreX Transformation (which includes Data Model Broker), OpreX Control, OpreX Measurement, OpreX Execution and OpreX Lifecycle. These solutions work together to deliver operational excellence throughout an enterprise's activities, from supply chain optimization to production, with risk and business management functionality included.
Takahiro Kanbe is a product manager for OpreX Data Model Broker with Yokogawa Electric Corporation. He joined Yokogawa in 1999 as a software engineer for integrated control systems. Kanbe uses his experience to lead product planning and development, combining customer requirements with the latest technology available to achieve optimal results.
Yokogawa


