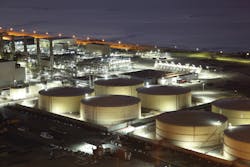
Storage tanks are common sights in the petroleum industry. At some point on its journey from the wellhead to the consumer, a barrel of crude oil will spend time in a storage tank.
To keep storage tanks working safely and efficiently, tank owners undertake a program of regular inspection and maintenance. The American Petroleum Institute defines inspection standards for aboveground steel storage tanks used in the petroleum and chemical industries. These standards, known as API 653, are widely accepted around the world. In the United States, tanks must be externally inspected every five years (older tanks may require more frequent attention). Tank interior inspections are performed based on documented corrosion rates or individual tank attributes.
Central to API 653 tank inspections is the accurate physical measurement of tank shells, bottoms and roofs. But precisely measuring storage tanks is not a simple task. Safety requirements and the large size of tanks combine to present challenges to the measurement process. Conventional surveying techniques can meet API standards, but the process is time-consuming and does not produce comprehensive information.
A new approach for storage tank inspection integrates high-speed laser scanning with specialized office software and advanced techniques for data processing and analysis. The method reduces costs and improves accuracy in storage tank inspections.
Automating inspection reports
For new tanks, API 653 calls for data on verticality of tank walls and roundness of tank shells. Today, the measurements are typically gathered using conventional surveying instruments known as total stations. Depending on the size of the tank, multi-person crews use a total station to capture data on 12 locations (or “stations”) around a tank. Most modern total stations can measure directly to the tank shell, which speeds measurement and provides data for verticality analysis. A skilled crew can complete a survey of the exterior of an in-service 40-meter tank in about four hours.
For out-of-service tanks, inspectors can gather additional data on a tank’s interior and exterior — including measurements taken to assess the flatness of tank bottoms and any subsidence. Interior measurements may also capture any structural or other components inside the tank that affect tank capacity. Interior work adds time and safety considerations to the inspection but produces more comprehensive information.
Current inspection methods are well defined and accepted. But a newer technology — laser scanning — is proving that it can provide faster, more thorough and more accurate inspections.
Laser scanning uses lidar (light detection and ranging) to capture millions of individual points on a tank’s shell, floor and roof. Laser scanning also captures information on appurtenances such as nozzles, access points, stairs and ladders, as well as nearby structures and terrain. Cameras built into the scanner capture additional visual documentation of tank conditions.
Scanning provides significant savings compared to the time required using total station methods. Roughly the same size as total stations, a laser scanner can be easily carried and operated by one person. To conduct a scan, the operator selects a few locations around a tank where the scanner will be placed.
In just a few minutes at each location, the scanner captures a “point cloud” consisting of closely spaced 3D points on the tank and structures. The scanner also measures to all visible control targets. The operator performs multiple scans around the tank to capture the entire site. In most situations, crews using high-speed scanners can complete the work in less than one hour.
Handling tank point clouds
The real work begins when the data returns to the office. Specialized software combines (or “registers”) the multiple scans into a single point cloud. Technicians then perform cleanup to remove extraneous points and structures that aren’t needed for the tank analysis.
Early lidar processing software was focused on merging and managing point clouds and offered only limited functionality for analysis or modeling. With advances in software, the additional data from laser scanning provides a look at a tank that is far more detailed than anything provided by total stations.
Software advances have streamlined the analysis process as well. When laser scanning first came on the scene, it could take hours to process the raw data. From there, users loaded the data into CAD to extract verticality information. After that, the API reports would be produced manually.
Today, much of the work is automated according to Justin Naugle, 3D Imaging expert for Houston-based HMT Inspection, a service provider for the aboveground tank industry. Naugle described how he can use Trimble Geospatial RealWorks software to automatically register multiple point clouds into a single cohesive dataset and then perform basic cleanup and organization. The resulting point cloud provides a comprehensive, precise picture of the entire tank.
John Hazel, general manager of HMT’s Inspection Division, summed up the experience: “The scanner collects a large number of points, so we are not interpolating between points on the shell. When using total stations we found they were missing areas of deflections that didn't lie on a vertical survey line. Additionally, the bottom course of a tank is assumed to be round, but scanning reveals deviations on the bottom course in both the verticality and roundness aspects. Using this system allows us to have a true view of the entire tank.”
Leveraging the high-density data, built-in functions for tank analysis can quickly produce the standard API reports. Users can transfer results from RealWorks into external software packages if desired, but many firms elect to use the specialized routines in RealWorks to handle point cloud management and spatial analysis. Manually analyzing data and producing reports from total station data typically takes four hours or more. But with automated software, users can produce API reports in less than two hours.
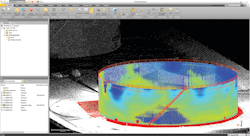
On out-of-service tanks where the interior is scanned, the software develops detailed maps of the tank floor and uses color-coding to indicate bends or depressions. Similarly, Naugle can compare a tank shell to a vertical cylinder model and automatically identify bulges or deformations that exceed a specified amount. He can also examine the tops of tanks, including floating roofs and geodesic domes.
More information in less time
API standards call for observing 12 stations around a tank, but laser scanning provides data on the entire tank. Analysis software can flag inward or outward deformation at any location to give clients a better evaluation for planning maintenance strategies and maximizing tank integrity.
Software also helps in managing the area around a tank. With only a marginal increase in time on site, field operators can extend the scans to capture the surrounding ground and containment features. “The data density increases by an order of magnitude,” Hazel said. “With a total station we might gather 100 points on a containment dike. Scanning gives us millions of points and reveals the nuances of the shape of the dike.”
Using that dense data, customized routines in the software enable technicians to quickly isolate the structure of earthen berms that make up a secondary confinement. Then, according to Trimble Geospatial scanning product manager Jason Hayes, the software can develop precise models and identify low areas or spill points in the containment berms. The system also computes the capacity of the containment. This value is compared to the measured capacity of the tank to determine efficacy of the secondary containment, Hayes said. The analysis can even account for any expected rainfall and adjust the containment capacity as needed. “Clients know exactly where to repair a dike or what they can do to bolster storage capacity in the containment,” Hazel added.
Throughout the processing, analysis and reporting phases, the software provides a 3D visualization of a tank. Users can create views from anywhere in the project, including viewpoints from inside or above the tank. Viewing software enables clients to make virtual “visits” to the project and make basic measurements of the tank or structures while preserving the integrity of the original data.
The visualization tools do more than help clients understand the measurements and results. For example, some clients need to explain issues to other stakeholders. The graphics and extra reporting help them justify needed expenditures to non-technical administration and financial personnel.
One of the most valuable aspects of scanning is the ability to conduct a virtual revisit at any time. If a client requests additional information or questions a report, technicians can quickly access actual measurements and field data to address the issue. “You can always go back to it; there is physical data to back everything up,” Naugle said.
The value of data density
To illustrate how high-density data can help reduce costs in repairs and upgrades, Naugle described work to install a geodesic dome onto a new tank. A contractor had built a dome based on design drawings, but without a scan. The dome didn’t fit by a few inches and construction teams spent three days trying to make it work.
When the dome was finally in place, Naugle used HMT’s Trimble TX5 scanner to scan the tank. After processing, the analysis pinpointed the exact locations of the misfits and revealed that the diameter at the top of the tank shell was a few inches out of tolerance. Naugle also found that the tank was concaving at the top. “A few hours of scanning and processing would have saved several days worth of money and frustration,” Naugle said.
Scanning moves to the mainstream
Laser scanning brings significant upside potential to tank inspection, including improvements in time, cost and safety. Rather than requiring two or three people on a site for several hours, one person can complete a job in an hour or two for an in-service tank. Scanning cuts the time spent in tank interiors, reducing safety concerns and enabling analysis of interior features even after the tank is refilled.
The specialized software functionality is an essential part of tank analysis. Hayes noted that traditional approaches can miss problem areas while point clouds and tank-specific processing provide comprehensive inspection and evaluation. Naugle pointed to functions such as heat mapping that reveal deflections over the entire tank surface. The scanning solution provides much more data than is required under existing inspection standards, which is helping drive acceptance in the tank industry.
Hazel agreed and emphasized the value of capturing as-built scans on new and repaired tanks. The baseline data provides inspectors and engineers a better picture of tank structure and condition. The data enables their clients to make more informed decisions about tank maintenance and repairs. Hazel also sees tank calibration as an excellent application for laser scanning and analysis.
While the industry is notoriously conservative in adopting new technologies, Hazel expects laser scanning and software will continue to grow for tank inspections. “The big value will come in time, as companies acquire calibrations and baseline data to compare with subsequent scans to assess change or damage over time. Here on the U.S. Gulf Coast we are prone to hurricanes. If you have a model beforehand, then you can see what has changed on a tank as the result of a storm.”
Hazel noted that coming up to speed with scanning requires a focused effort and shared what HMT has learned in implementing laser scanning into its inspection portfolio. “Plan on a learning curve and don’t rush into it,” he said. “It’s important to understand the nuances of the system and develop good procedures. The effort will pay off.”
John Stenmark is a writer and consultant working in the geospatial, AEC and associated industries. A professional surveyor, he has more than 25 years of experience in applying advanced technology to surveying and related disciplines.


