A new approach to data-driven process improvements
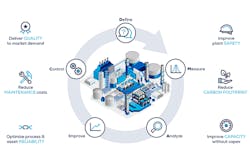
Figure 1. Six Sigma’s DMAIC cycle is at the center of achieving organizational-wide operational excellence goals. Even if you do not follow the Six Sigma method, the DMAIC cycle is still a valuable approach for any continuous data-driven improvement project. All graphics courtesy of TrendMiner
Although not adopted by every organization Lean Six Sigma is the most well-known method to transform whole organizations into a data-driven and continuously improving company. Where Lean addresses process flow and waste issues, Six Sigma focuses on variation and design and these complementary disciplines are aimed at promoting “business and operational excellence.” Even if not adopted, the basic method and philosophy of Lean Six Sigma can be applied into everyone’s day-to-day thinking to achieve higher levels of operational excellence.
One of the challenges operational excellence executives face, however, is getting their entire organization to contribute and participate in continuous improvement programs. Most companies have multiple ongoing projects, but have only a handful of trained team members who are proficient enough in the use of the statistical methods to validate cases before and after implementing the improvements. Allowing process and asset specialists to contribute to these projects would dramatically increase the operational improvements needed to meet the expected organizational goals, and that can be achieved using time-series-based advanced analytics —with better and faster results.
DMAIC is a good start — but current tooling doesn’t deliver in the age of big data
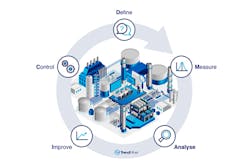
Six Sigma projects typically follow a methodology inspired by Deming’s Plan-Do-Check-Act Cycle and consists of five phases: Define, Measure, Analyze, Improveand Control, also known as the DMAIC cycle.
At first glance this structured approach seems like a perfect fit for continuous data-driven improvement within the organization and therefore, facilitating a strong involvement of the Six Sigma philosophy in daily operations. The current tools and methods used, however, within the DMAIC cycle prove to have limitations for the Six Sigma stakeholders on the plant as well as on the central level when dealing with this reality.
Each phase of the DMAIC cycle must be evidenced by results, requiring a statistical approach, knowledge and expertise. For Six Sigma, a training program exists, where students can get belt certifications such as green, black or master black belt. Given the statistical approach and the training program, often there are only a few people in the organization who are black or master black belt level, in charge of the continuous improvement projects.
Typically, continuous improvement experts may serve the organization via a central operational excellence center, and with few experts in this field, bottlenecks may arise. Additionally, many projects may concern production performances where asset and process expertise is required. If those subject matter experts are unfamiliar with the statistical project approaches, many projects can end up going unfinished.
Additional impacts for the organization and everyone involved include:
- Underutilization of the local process expertise (plant level)
- Missed improvement opportunities
- Long project cycles
- Lack of symbiosis between plant and central level stakeholders
- Potential financial losses for the organization
The structure of the DMAIC cycle is well-suited for data-driven analysis, but the tooling is not currently up for the challenge. What is needed is a way to provide a common method of analyzing process data between central and plant level team members that significantly lowers the threshold for starting improvement projects. The data gathering, modeling and analysis may be hurdles for many asset and process engineers using the DMAIC method for continuous improvement, but new approaches are available to overcome them.
Self-Service industrial analytics and DMAIC —A match to jumpstart continuous process and asset improvement
Self-service industrial analytics takes a new approach in providing industrial process data analytics for stakeholders throughout the organization. The approach combines the necessary elements to visualize a process historian’s time-series data and overlay similarly matched historical patterns and enriches it with data captured by engineers and operators. Furthermore, unlike traditional approaches, performing this analysis doesn’t require the skill set of a data scientist or black-belt expertise since the user is always presented with easy-to-interpret results.
Key elements of a self-service industrial analytics platform to look for include:
- A system that brings together deep knowledge of both process operations and data analytics techniques to gain value from the operational data already collected. Such a system will minimize the need for specialized data scientists or complex, engineering-intensive data modeling and can turn human intelligence into machine intelligence.
- A model-free predictive process analytics (discovery, diagnostic and predictive) tool that complements and augments, rather than replaces, existing historian information architectures.
- A system that supports cost-efficient virtualized deployment and is "plug and play" within the available infrastructure, however has the ability to flawlessly evolve into a full scalable setup that fits in with corporate big data initiatives and global environments.
Based on these key elements, self-service industrial analytics is exactly what is currently lacking for supporting each phase of the DMAIC cycle. Empowering local subject matter experts with advanced analytics tools enables them to contribute to operational excellence goals, whether a project is small in scope or has a long-term focus.
How does self-service industrial analytics fit into the DMAIC cycle?
- DEFINE PHASE (DMAIC)
In the define phase, the main goal is the definition and scoping of the problem/project and prioritization based on the cause/effect relationship. To easily examine an issue it is important to have quick access to various data sources, which self-service analytics solutions provides.
Figure 2. The DMAIC cycle is a valuable approach for any continuous data-driven improvement project. Self-service industrial analytics tools speed up the execution of each phase where time-series process and asset data can be used by subject matter experts.
Anyone who works with data in any capacity knows that analyzing the cause/effect relationship of a symptomatic upset starts with rigorous data preparation. So it is important that self-service analytics provides an easy way to answer the question; "Which process conditions are representable of my symptom at hand?" With self-service analytics, process data is searchable and includes context information from various sources and stakeholders involved in the production process, creating a full and clear picture of the problem at hand. Because prioritization is usually related to business impact, it may be necessary to calculate relevant key performance indicators (KPIs). Here, a simple formula editor enables users to create those KPIs and make them available for any further analytics.
- MEASURE PHASE (DMAIC)
Now that problem/project is defined, scoped and prioritized, a baseline performance as well as objectives need to be established. In order to do so, access to all kinds of tags relevant for production is needed, which means that like in the define phase, live connections to various data sources is crucial. In order to create an accurate baseline, either process expertise is needed or context information needs to be provided to assess similar situations.
A search engine for sensor-generated data that includes the context information plays a central role and gives the power to (local and central) process engineers to quickly retrieve similar situations. The complete relevant history of the data recorded can be utilized to save a baseline performance of the situation.
- ANALYZE PHASE (DMAIC)
The analyze phase is about determining root cause(s) that contribute toward the project’s objective. Since processes in the process industry are of non-Markovian nature, allowing for time shifts is vital for both hypothesis testing and generating new insights from historical data. The first will happen within a predefined smaller set of tags, where the latter will need to be conducted either within an undefined or predefined big number of tags. For a self-service analytics platform to actually make a difference in this crucial phase of the DMAIC framework, a live connection to all relevant tags from various sources needs to be made and stakeholders need to be provided with interpretable results in an iterative way. This is an important aspect since full control will empower those stakeholders to utilize the whole added value of advanced analytics. The results should not be a black box, but easy to grasp and therefore, trusted and acted upon.
- IMPROVE PHASE (DMAIC)
During the improve phase focus is put on testing and confirming a solution. An example is altering the control concept of a column to see if the previously occurring flooding behavior is eliminated. In the process industry, this is usually done while production is running. The analytic needs, arising from this phase, are concentrated in online data monitoring, while optionally enabling a comparison against a stored baseline performance. This means that a well-suited self-service industrial analytics platform should offer straightforward creation of real time performance monitors, where the stored baseline can be utilized if needed. This enables various stakeholder(s) to check if the performed process change yields the desired results, which means the next phase, control, can begin.
- CONTROL PHASE (DMAIC)
In the control phase, the benefits of a successful project can be reaped for years to come on both local and global scales. The analytics needs in this phase are similar to the improve phase, which are online data monitoring including a baseline if needed. An additional need in this phase is the ability to monitor against signatures of early indicators that have been identified in the analyze phase, so that not just an early detection is ensured, but preventive warnings are issued. This leads to avoidance of the upset and is of greatest value to the organization. A self-service industrial analytics solution needs to provide the ability to mark signature patterns available for real-time monitoring. This builds a great foundation for following through on any gained insights based on low thresholds of adoption and common trust in the results obtained.
Conclusion
Using self-service industrial analytics to support the DMAIC cycle can result in various organizational benefits. By avoiding the need for high statistical expertise, many more people such as process, asset and field experts can start contributing to continuous improvement projects. It might even become fun to work on those structured improvement projects and help people get more quickly certified as green or black belts. Because of this, executives responsible for operational excellence can change the organization’s culture and meet their certification targets much faster.
Furthermore, using self-service analytics can result in more projects being executed per year, bringing faster results in areas such as reducing carbon footprint, quality improvement and reducing waste. The contributing subject matter experts will proactively be generating new insights with use of the extensive capabilities of a self-service industrial analytics platform. Finally, the improvements achieved for one asset, production line or plant can be shared across the organization, improving operational excellence within the entire business unit or fleet.
Fully embracing the power of self-service industrial analytics should lead to an organizational change toward data-driven process improvements with empowered subject matter experts to meet every potential opportunity.
Edwin van Dijk is vice president of marketing at TrendMiner. He has more than 20 years of experience in bringing software solutions for the process and power industry to market. Various roles from business consultancy to product management gave van Dijkthe experience to expand TrendMiner’s footprint in the market.

