Advanced analytics accelerates asset management
Chemical companies’ assets include complex, customized and expensive process-critical equipment. The performance of these assets is often characterized by first principles equations, requiring deep subject-matter expertise for analysis. These analytics can be challenging to execute at scale, resulting in many disparate models created by many different process engineers, each working in their own organization silo.
The ability to create flexible, theory-driven and dynamically updating models that can rapidly scale across the whole of a companies’ similar assets is the aspirational asset analytics strategy. Advanced analytics applications are making this possible by unifying data sources, enabling complex and high-volume calculations and putting iterative, user-friendly asset model building tools into the hands of process subject matter experts (SMEs).
Barriers to asset management at scale
Advanced analytics can be an intimidating concept for engineers responsible for monitoring the performance of dozens, or sometimes hundreds, of similar equipment assets. Much of this intimidation stems from the perception that performing analysis for assets that span multiple units, sites or geographies is incredibly time consuming, and much of this fear is rooted in real-world experience.
One of the most time-consuming steps in the development of an asset monitoring solution is wrangling data from multiple databases — historians, maintenance databases, etc. — into a single environment. The gathering place for such combined data sets has traditionally been huge Excel spreadsheets, with users forced to rely on add-ins to query source databases.
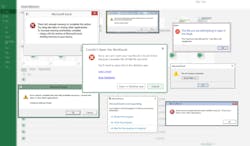
Another limitation of spreadsheets, and many statistical analysis software packages, is the inability to easily perform calculations that combine sensor data with contextual event data. These types of calculations can be critical to compare performance of equipment from batch to batch, or from one maintenance cycle to the next. The key performance indicators used as a basis for assessing asset performance over each cycle often are calculated using complex differential equations rooted in engineering theory. The calculations governing thermodynamics, reactor kinetics and fluid mechanics are common examples that push spreadsheets to their limits, and often beyond (Figure 1).
Even if an analysis overcomes the data access and analytics hurdles, the challenge of how to scale the impact of the analysis remains. For a global chemical company monitoring hundreds of heat exchangers, dryers and compressors, a copy + paste + swap approach to scaling analytics is not feasible.
Companies with an organized asset hierarchy in place are better positioned but may face different scaling challenges. These asset management systems can be rigid, owned by IT and modifiable only by select administrators. Scaled analytics are possible if, and only if, each required input lies in the correct location within the asset template. Additional barriers are met when similar assets are instrumented differently, requiring different assumptions when applying first principle models for monitoring and predictive analytics.
The final hurdle is collaboration and reporting at scale. Compiling rollup views across sites in the form of high-level management reports requires advanced permissions configurations so users are exposed only to the data they need to analyze and consume. Single-asset level reports must be rapidly generated for an asset selection of the owning engineer’s choice, and it must be easy to toggle among these reports.
Asset-friendly analytics overcome obstacles
A solution to these challenges begins by establishing a live connection to each of the source systems that contain the data necessary to perform analytics across a selection of site or company assets. A solution to the data access challenge is cloud-based advanced analytics applications that connect natively to the many process data historians, SQL-based data sources storing quality data and contextual information stored on-premises and other sources, some of which may be cloud-based.
These advanced analytics applications also provide connectivity to existing asset hierarchy systems offered by process automation and historian companies, as well as by third-party vendors. For organizations without a built-out asset structure, mechanisms for building asset groups tailored to specific use cases exist in these advanced analytics applications and are presented in an unintimidating, point-and-click environment (Figure 2).
An advantage of this in-app asset group construction is that it is all done by an SME, who has the knowledge of all required process signals and contextual information, as well as the expected output of the use case in mind. Calculated attributes can be built into the asset tree, with the added flexibility to selectively modify calculations for assets based on available instrumentation and equipment specifications. A subset of existing assets can be added to minimize compute time and to limit views to only the assets of interest within an existing structure.
A series of point-and-click analytics tools, along with low-code formulas for time-series-specific functions, are used to build calculations. When users perform univariate or multivariate descriptive, diagnostic or predictive analytics on one asset, asset swapping functionality allows them to instantly view their work applied to a new asset.
Cross-asset treemap, table and chart views enable easy comparison and benchmarking of assets within a site or business unit. Asset support in both analytics’ generation and dashboarding environments let engineers and analysts easily create single asset reports, with functionality provided to toggle among assets. Reports, dashboards and workbooks are shareable via browser links, which are available to anyone in the organization with proper permissions.
Asset scaling enables high-value use cases
Use case #1: Conveyor belt tension modeling
A manufacturer of specialty crystalline polymers packages produced material into bags, which are transferred via a conveyor system to a robot line that places the bags into 1-ton boxes. The manufacturing process has limited hold-up capacity and was experiencing production rate losses due to conveyor belt trips on the packaging floor. The conveyor belt outages sometimes caused significant delays, forcing reactor production shutdowns. A post-mortem analysis of the previous year’s conveyor trips revealed the leading cause of belt trips to be falling below the low-low tension trip point.
Finishing process engineers had been struggling to devise a way to reliably forecast the behavior of belt tension. The tension often held steady for days or weeks following maintenance and then would fail exponentially. Each conveyor belt in the system demonstrated a different degradation rate, and even the same belt sometimes returned to a different tension baseline following maintenance. As a result of these challenges, engineers were forced to build numerous one-off models using Visual Basic in Excel. With no good way to operationalize the Excel models to alert when tension began dropping off, most low-tension trips were still occurring. Each time a belt was maintained, a new model had to be derived. Repeating these tasks every few days for each of the vulnerable belts on the packaging floor quickly became overwhelming.
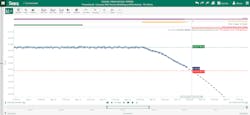
The process engineers for this facility were able to overcome the challenges of their traditional approaches using Seeq, an advanced analytics application. By connecting live to the packaging floor historian, refreshes of sensor data in Excel were no longer required. Event identification via Seeq capsules and conditions enabled the SMEs to rapidly identify each belt maintenance cycle and the periods during each cycle where the belt tension began to rapidly degrade. Isolating each maintenance cycle allowed for calculation of cycle-specific baseline tension and for setting low-tension warning trigger deviations from baseline tension. A regression model of tension based on time-in-service was used to forecast the future behavior of the tension signal and to identify the date and time when belt tensioning should be scheduled. The model training data set was configured to be dynamic, re-training on initial degradation data during each tension cycle (Figure 3).
When it came time to evaluate the application of the model forecast across all assets in the conveyor fleet, the Asset Groups functionality in Seeq Workbench enabled SMEs to create ad hoc asset structures using a point-and-click interface. By associating each of the relevant tension signals to the correct asset, each of the intermediate calculations in the model-building process was pointed at the tension signal for the correct asset.
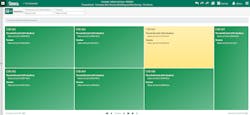
The result was a series of asset-specific and maintenance-cycle-specific regression models, each forecasting future maintenance requirements in near-real time. A roll-up treemap was created to provide a high-level summary of the critical packaging floor conveyor belts and their current tension status (Figure 4).
This view was leveraged by operations and maintenance teams at the start of each shift to prioritize belt maintenance activities for the day.
Use case #2: Extruder rheometer validation
A large petrochemical manufacturing company with nearly 100 polymer extruder lines distributed across multiple sites and geographies recently installed online rheometers to measure the viscosity of their finished product prior to pelletizing. But before the online rheometer measurements could be trusted and actionable, plant personnel needed to validate these readings against offline lab data for a few months.
A centralized engineering group was tasked with performing rheometer validation. Because the extruders were distributed across sites, this involved coordinating with numerous site personnel to gain access to the relevant process historian and analytical lab data. Without a good way to organize the data by asset, they were left with a multi-tab spreadsheet approach, requiring them to repeat the calculation methodology for every extruder line. This approach was quickly seen as too time-consuming, and an alternative solution was sought.
The first challenge was getting the process and lab data from each line at each site accessible from a single application. Seeq data connectors, with native networking to all major manufacturing data historians and SQL data sources, were used for this task.
The data also needed to be organized. Analyzing the data for all extruders at once was overwhelming, and the engineers needed a way to focus their efforts on a single extruder and rheometer as a starting point, with the capability to apply their analytics to all the other assets, once tuned.
They used Seeq Data Lab to systematically locate the relevant rheometer viscosity signals and offline lab measurement signals and to build them into an asset hierarchy with layers for region, site and extruder line. They were also able to build simple calculations and roll-up calculations into the tree to quantify the maximum and average lab versus rheometer deviations by site, region and overall.
The asset hierarchy built into Data Lab was then accessed in Seeq Workbench, where engineers used the point-and-click Value Search tool to create capsules indicating periods of high deviation between the online and lab measurements. The drilldown functionality of treemap visualizations were leveraged to highlight sites with rheometers reading significantly different from the lab measurements.
This site-wide aggregation uncovered differences in the rheometer cleaning procedures used by different sites, some of which allowed foulant material to build up on the rheometer inlet, causing inflated online viscosity readings. Alignment of best practices for rheometer maintenance led to increased accuracy of rheometer readings, allowing the production facilities to decrease the frequency of lab viscosity testing, resulting in time and cost savings, along with reduced risk.
Use case #3: Flexible heat exchanger monitoring solution
A leading European chemical company needed a solution to improve maintenance planning and to minimize unplanned downtime due to fouling of process-critical heat exchangers. The performance of the heat exchangers has a direct impact on the ability to meet product quality and throughput targets. They also needed to streamline heat exchanger monitoring and reporting across the organization. One of the major challenges they faced in previous attempts to solve this problem was the variability among exchanger types, process service and level of instrumentation.
Traditional heat exchanger monitoring tools built in Excel and based on first principle models fell short due to rigidity in configuration requirements and lack of live connectivity to the necessary data sources. To build and deploy an online heat exchanger monitoring tool, a live connection to the process historian data and maintenance event data for each site was needed. Additionally, the company needed the ability to configure an asset model containing variable calculation mechanisms for key performance indicators, like heat transfer coefficient, based on the available instrumentation. Ultimately, they hoped to use predictive analytics to generate forecasts of key performance indicators like U-value and log mean temperature difference.
The company selected Seeq to provide a live connection to the relevant process and maintenance data sources at each of their manufacturing sites. With the data accessible, they used Seeq Data Lab and its Python library functions to locate the data for each critical heat exchanger and to assign relevant metadata, and to then build the results into a hierarchy based on the metadata.
Conditional statements in the python code were used to build U-value formulas specific to the exchanger type and available instrumentation. The asset structure — comprised of raw signals, conditions and formulas — was used in Workbench, where users, even those without any programming experience, could interact with the data, build forecasts and identify upcoming maintenance requirements.
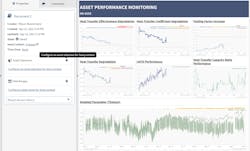
Asset swapping capabilities in Workbench allowed the engineers to quickly analyze U-Value degradation rates of different heat exchangers. Table views scaled across assets enabled them to compare critical metrics like heat exchanger degradation rates across sites or exchanger types. Various monitoring views for one heat exchanger were compiled into a report built in Seeq Organizer. With the desired views compiled, plant personnel used the asset selection capabilities, configurable in Organizer, to toggle among the different heat exchanger reports (Figure 5).
These reports are consumed by site operations daily to inform operational adjustments and by site maintenance teams monthly to assess turnaround timelines.
Use case #4: Capacity utilization model comparison
A major agrichemical company recently made updates to its site energy balance calculations used to model capacity utilization at the unit, plant, site and global levels. Before putting the new model into operation, they wanted to validate that the resulting capacity utilization calculations were aligned with the existing model. A centralized engineering team was tasked with performing this validation.
Both the existing and new capacity utilization calculations were built in PI Asset Framework and located in two similar but separate hierarchies. They needed a way to selectively combine data from the two asset models, identify when divergences occurred and gain insight into the processing conditions under which they occurred. The company had begun rolling out Seeq to each of its global sites, and the two asset models were already connected to Seeq, with the exact asset structures mirrored in Workbench.
Using Data Lab, they were able to locate all the capacity utilization signals at various levels of the old and new model hierarchies, along with critical metadata like hierarchy path. The paths were merged to create a single asset tree containing the same hierarchical layers as each of their original Asset Framework trees but simplified to only include the signals for the old and new capacity utilization signals. This new structure was pushed into Workbench where engineers could begin by focusing on the two models for a single unit, comparing the values and flagging deviations of more than 1%.
Treemaps were used to provide roll-up views of sites and plants with one or more severe capacity utilization model output discrepancies. Model deviation events were summarized in Workbench’s table view, where metrics, like the count of and duration of old and new model deviations, could be easily displayed over daily or weekly time frames.
Leveraging the asset tree functionalities in Workbench and Data Lab allowed them to configure the model validation calculations one time and then quickly scale them throughout all the capacity utilization model signals at all layers of the hierarchy. The engineering team estimated that this approach, which took only a few hours, would have taken at least a week of engineering time with Excel and required brute force methods.
Conclusion
Solutions to asset management challenges must be scalable as more sensors are added to systems, providing increasing amounts of potentially valuable data. Without appropriate analytics tools, existing data sources providing key contextual information will continue to be underutilized.
Advanced analytics applications empower plant personnel to analyze all sources of data easily and quickly, wherever they are stored. These solutions also provide a flexible framework to assist in scaling an analysis performed on one asset to a group of similar assets. As demonstrated by the use cases, the results of these analyses improve operations by increasing uptime, minimizing operating costs and improving safety and sustainability.
Allison Buenemann is an industry principal at Seeq Corporation. She has a process engineering background with a B.S. in chemical engineering from Purdue University and an MBA from Louisiana State University. Buenemann has over six years of experience working for and with chemical manufacturers to solve high-value business problems leveraging time series data. In her current role, she monitors the rapidly changing trends surrounding digital transformation in the chemical industry and translates them into product requirements for Seeq.
Seeq Corporation
About the Author
Allison Buenemann
Allison Buenemann is an industry principal at Seeq Corporation. She has a process engineering background with a B.S. in chemical engineering from Purdue University and an MBA from Louisiana State University. Buenemann has over five years of experience working for and with chemical manufacturers to solve high value business problems leveraging time series data. As a senior analytics engineer with Seeq, she was a demonstrated customer advocate, leveraging her process engineering experience to aid in new customer acquisition, use case development and enterprise adoption. She enjoys monitoring the rapidly changing trends surrounding digital transformation in the chemical industry and translating them into product requirements for Seeq.


